R for Data Visualization
Here are several plots I created for my dissertation using statnet, ggplot2, and GIS shape files. Be sure to check out the R Graph Gallery for many more examples of R visualizations.
statnet
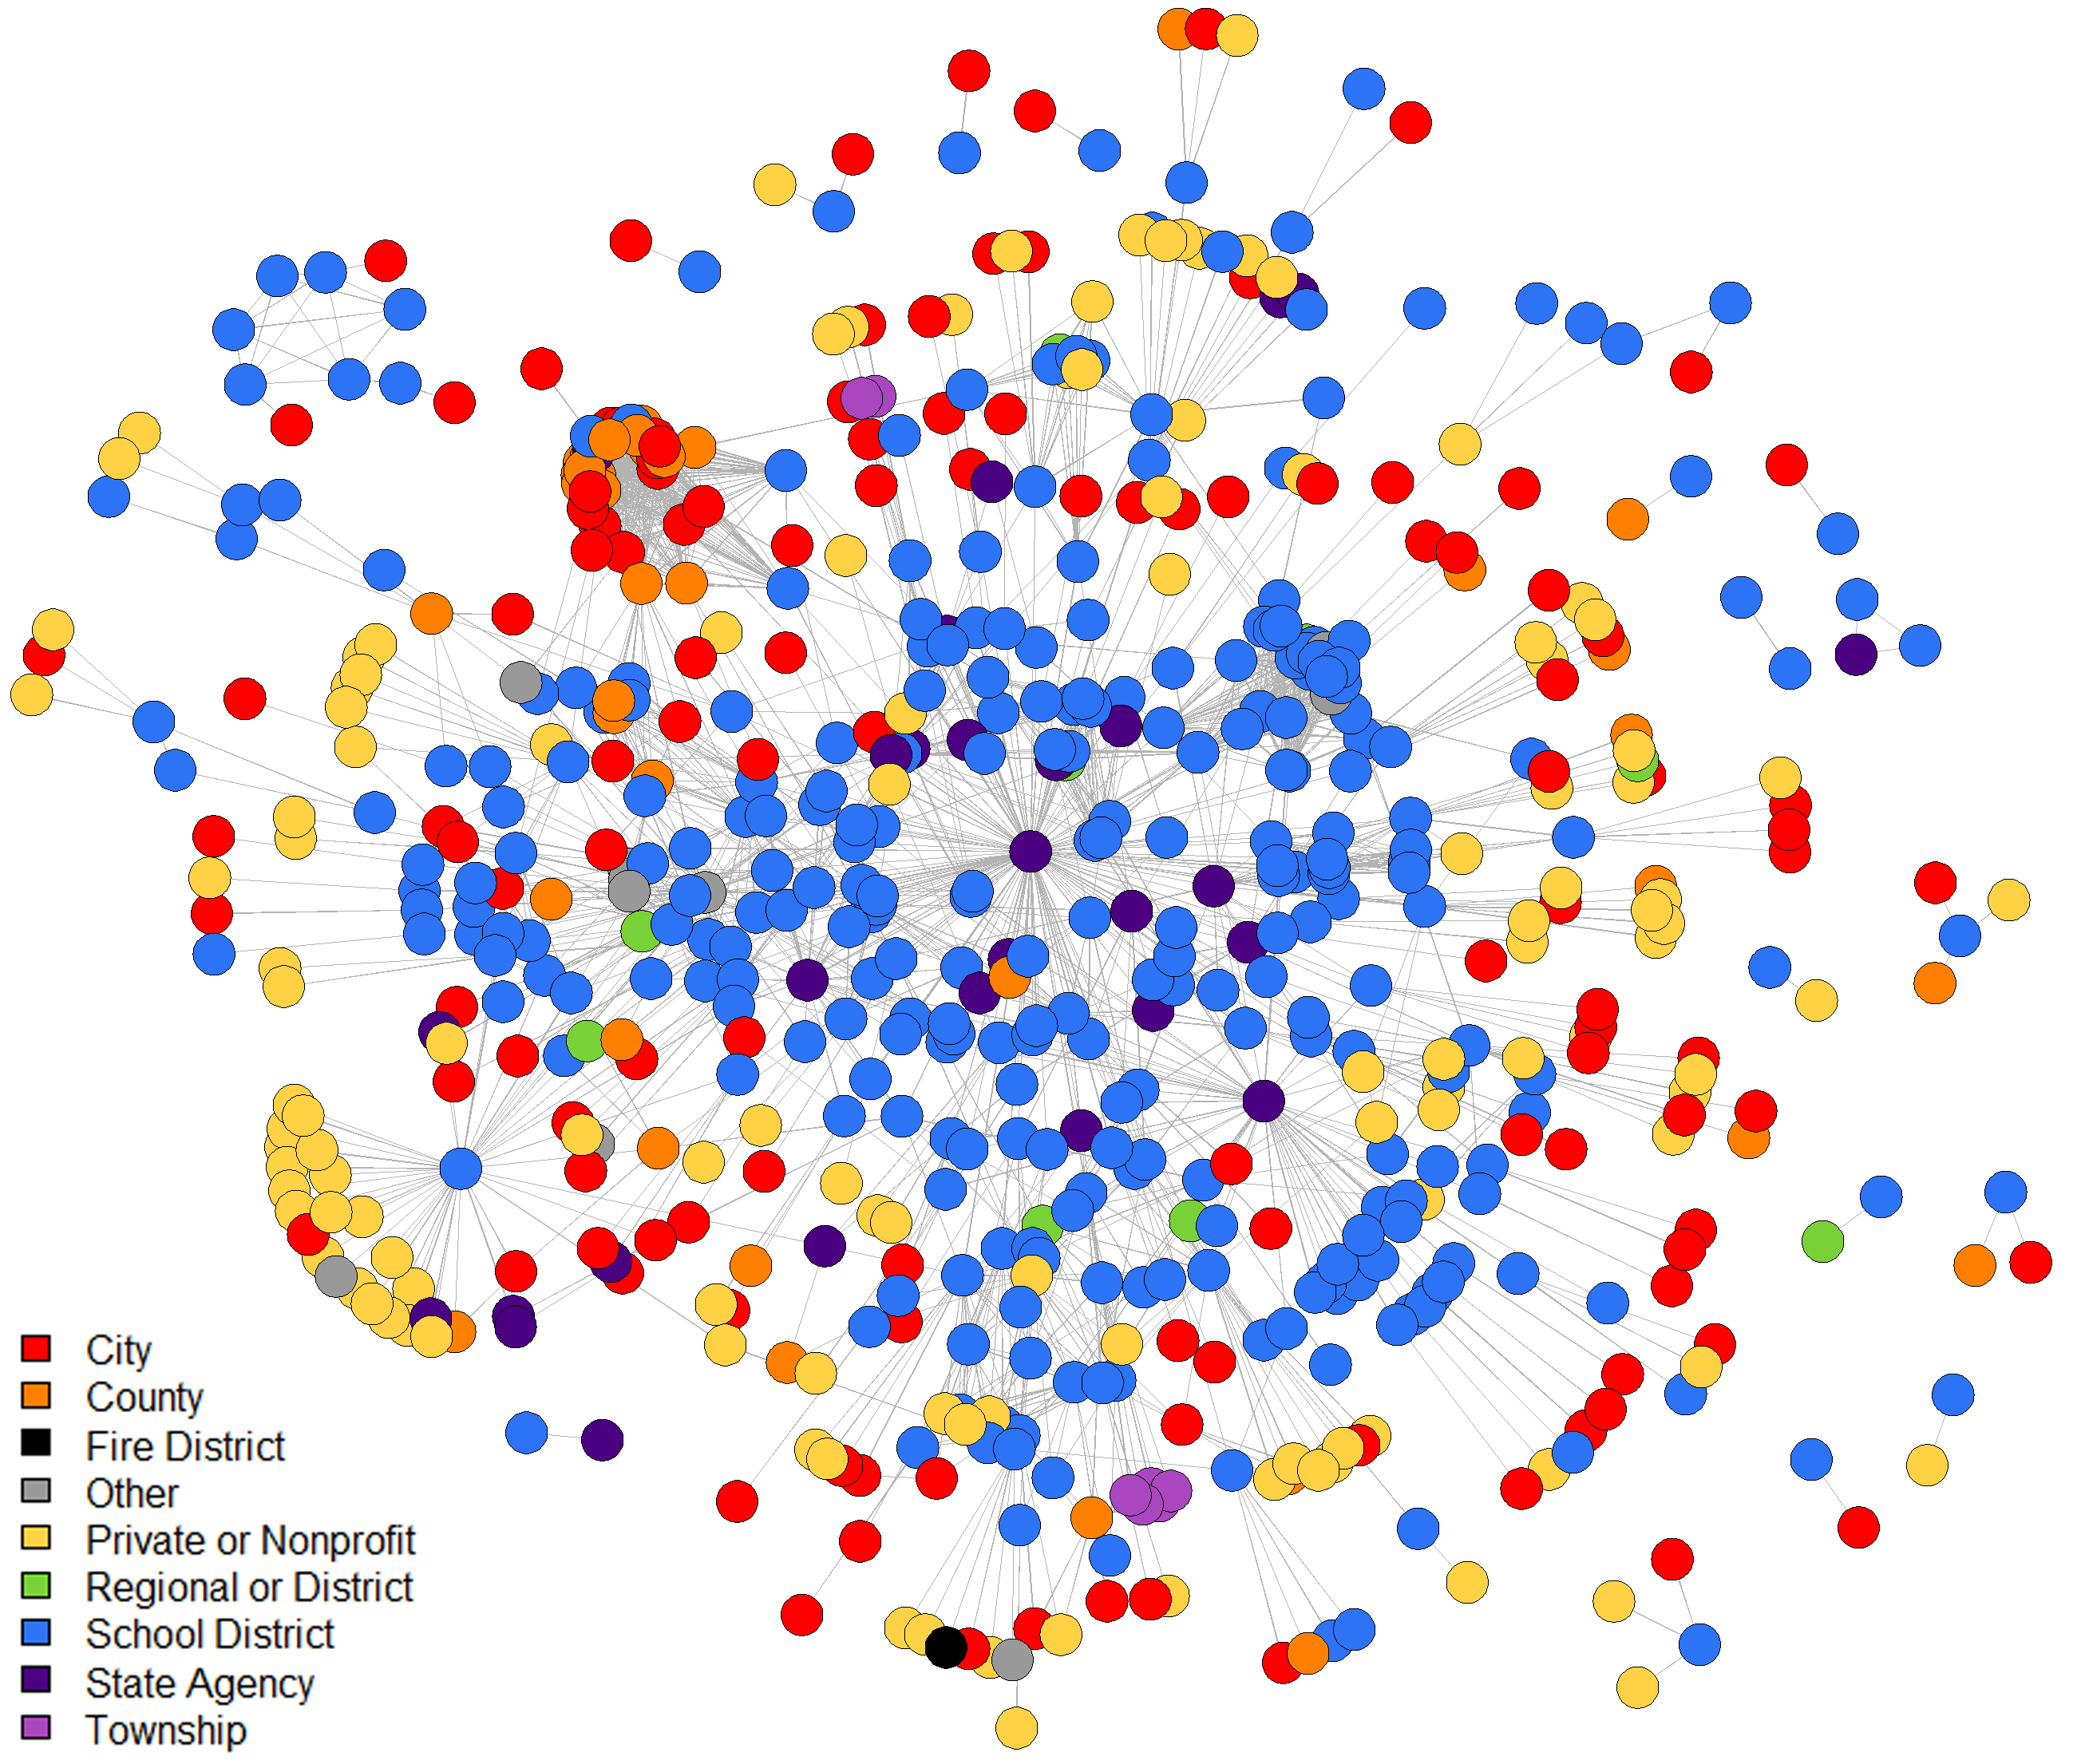
I consider Douglas A. Luke’s 2015 book, A User’s Guide to Network Analysis in R, to be the bible of network visualization. SNA scholars would be wise to invest in a copy.
colors = c(
    "#FF0000",
    "#FF8000",
    "#000000",
    "#999999",
    "#FFD246",
    "#78D237",
    "#2D73F5",
    "#4B0082",
    "#AA46BE"
)

plot(
    education_networks[[25]],
    displayisolates = F,
    vertex.col = colors[as.factor(network_attributes$org_type)],
    edge.lwd = 0.1,
    edge.col = "gray70",
    mode = "fruchtermanreingold",
    layout.par = list(niter = 10000), interactive = T
)
legend(
    "bottomleft",
    fill = colors,
    legend = c(
        "City",
        "County",
        "Fire District",
        "Other",
        "Private or Nonprofit",
        "Regional or District",
        "School District",
        "State Agency",
        "Township"
    )
)
Call ?network::plot.network to read the R help file on plotting statnet objects.
ggplot2
Use ggplot2:ggsave() with the Cairo package to create high-resolution, anti-aliased images suitable for publication or presentations.
library(see)

ggplot(imputed_normalized_attributes %>% filter(year > 1996), aes(non_white, color = as.factor(year))) +
    geom_density(size = 0.75) + xlab("Non-White Students") + ylab("Density") +
    theme_lucid(legend.position = "bottom", legend.text.size = 9) + labs(color = "")
ggsave("../Dissertation/Figure 11.png", width = 6.25, height = 7.5, dpi = 300, type = "cairo-png")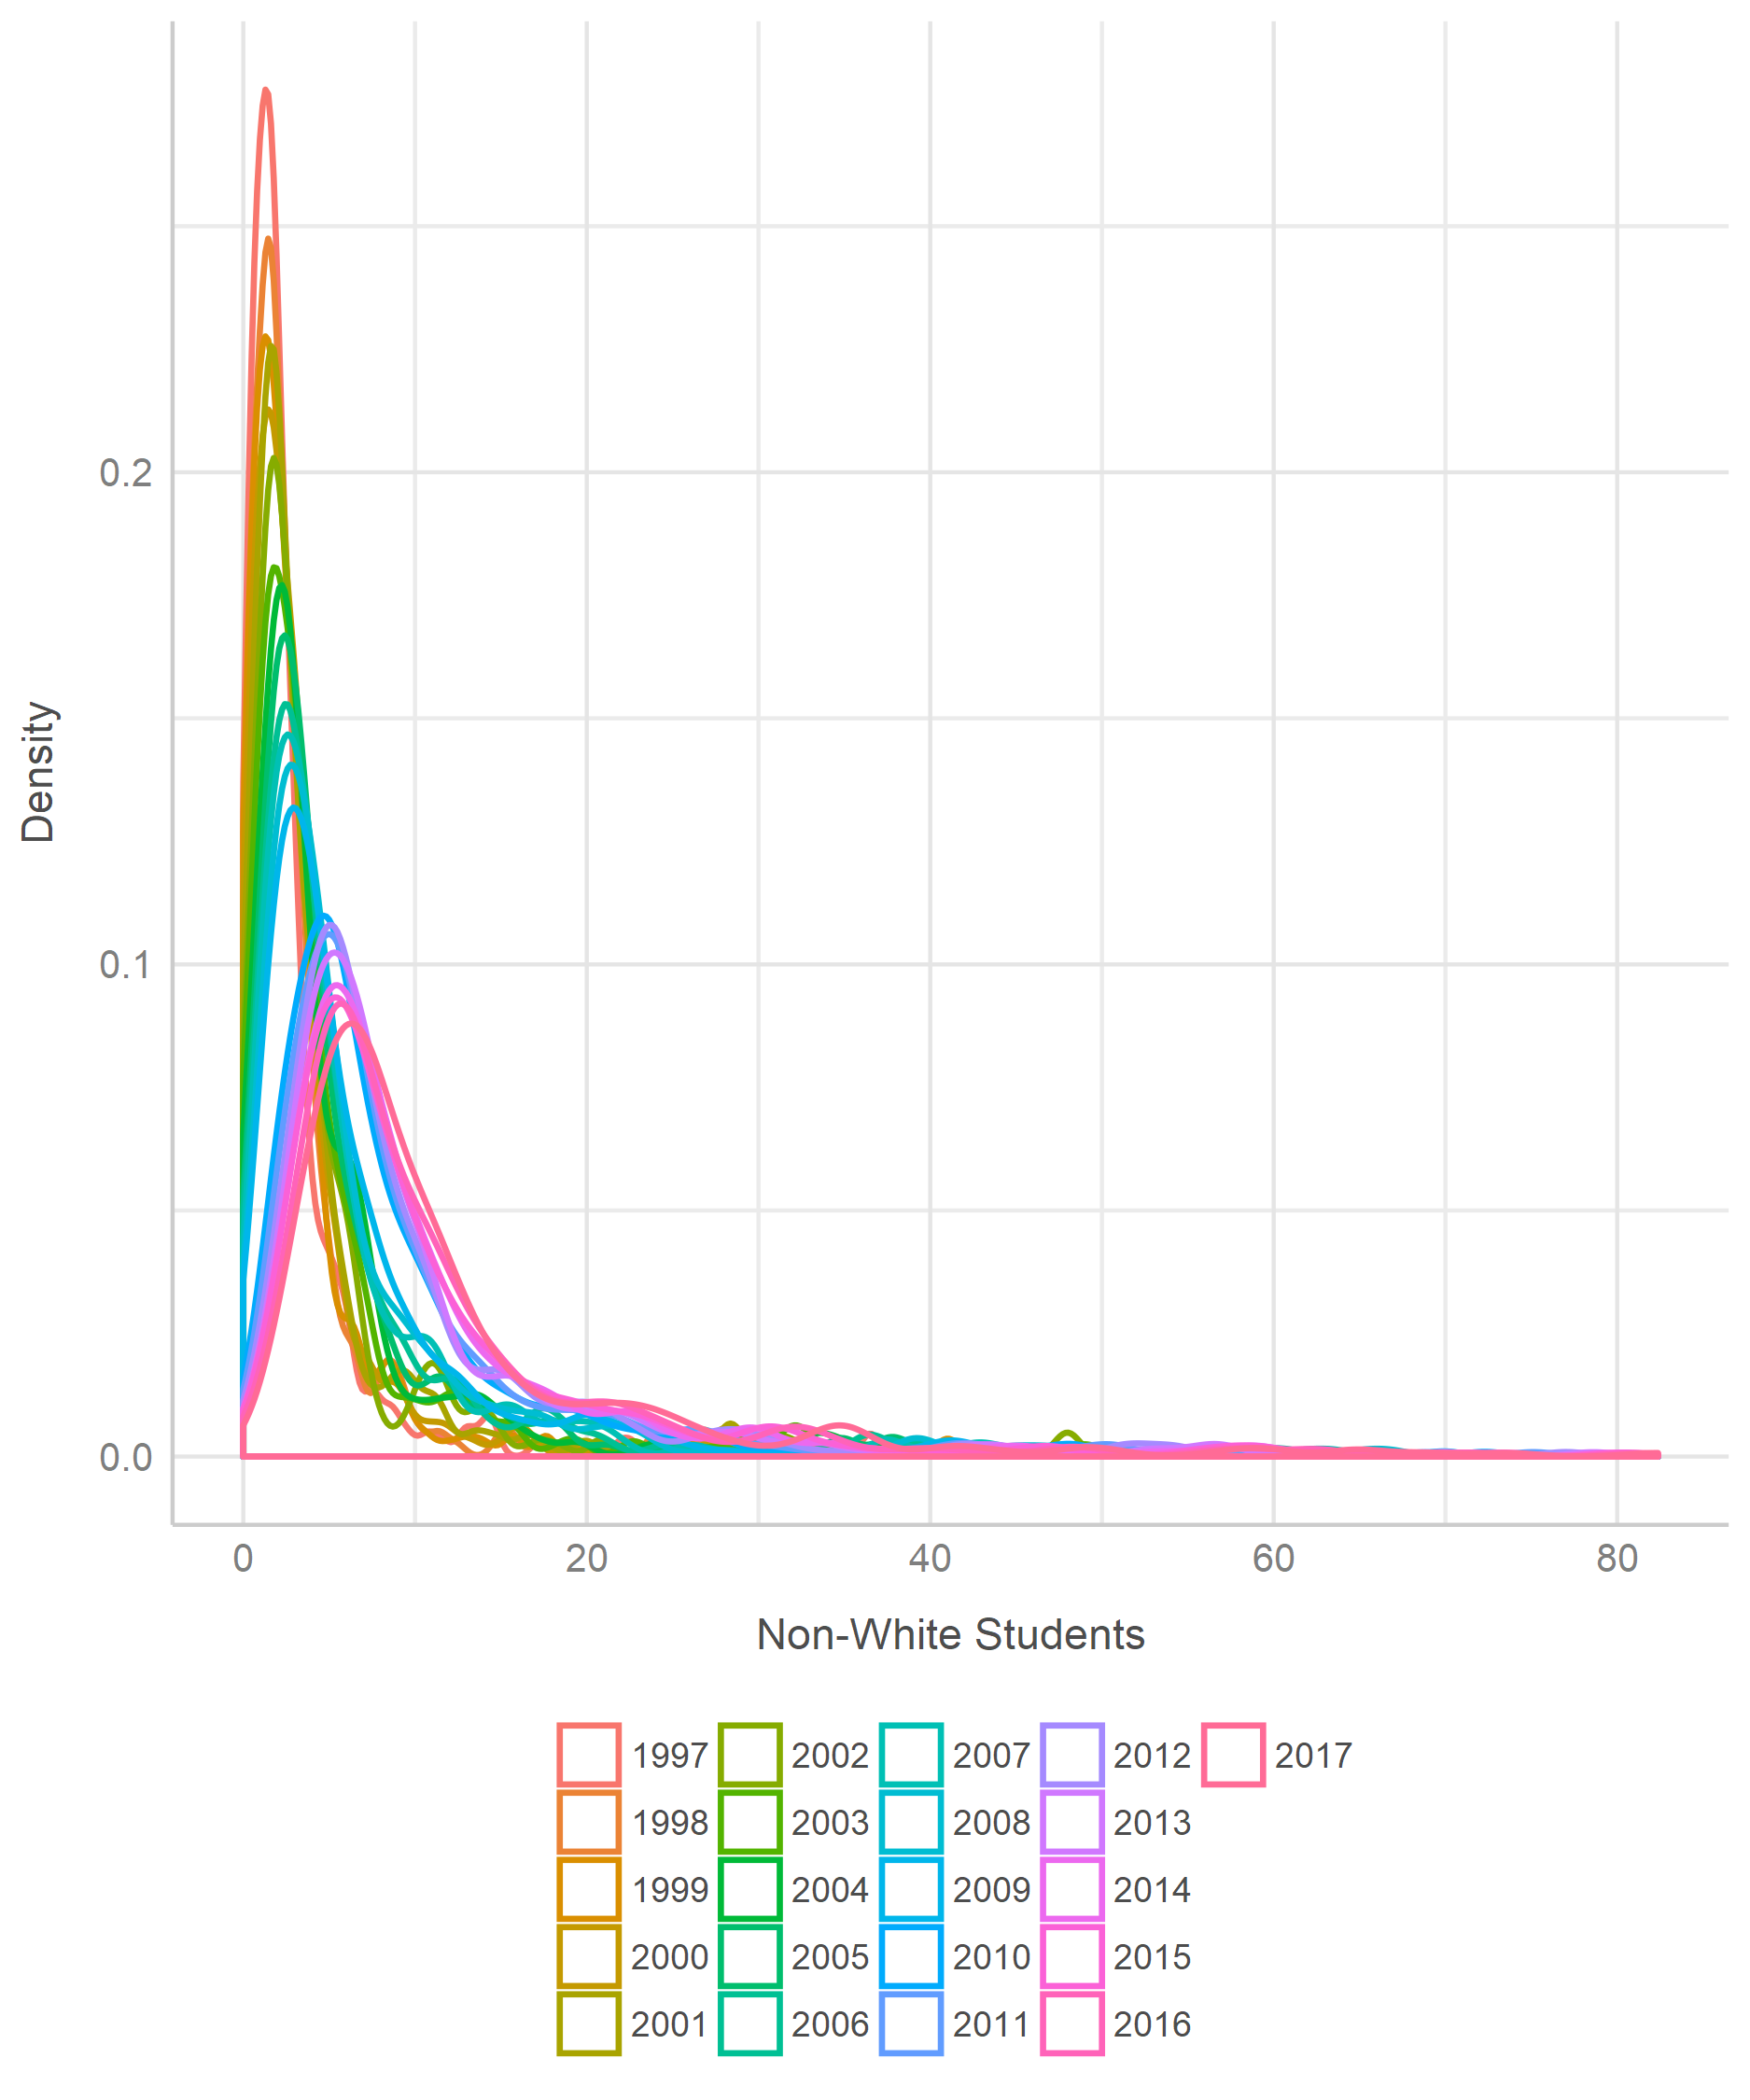
ggplot(data_for_plots, aes(year, mean_count, color = district_size_class)) +
    geom_point2(alpha = 0.33) + geom_smooth(se = F) + facet_wrap( ~ broad_topic) +
    xlab("") + ylab("Mean Active Agreement Count") + labs(color = "") +
    theme_lucid(legend.position = "bottom", legend.text.size = 9, axis.text.size = 9, base_size = 10) +
    scale_x_discrete(limits = seq(1995, 2015, 10))
ggsave("../Dissertation/Figure 16.png", width = 6.25, height = 7.5, dpi = 300, type = "cairo-png")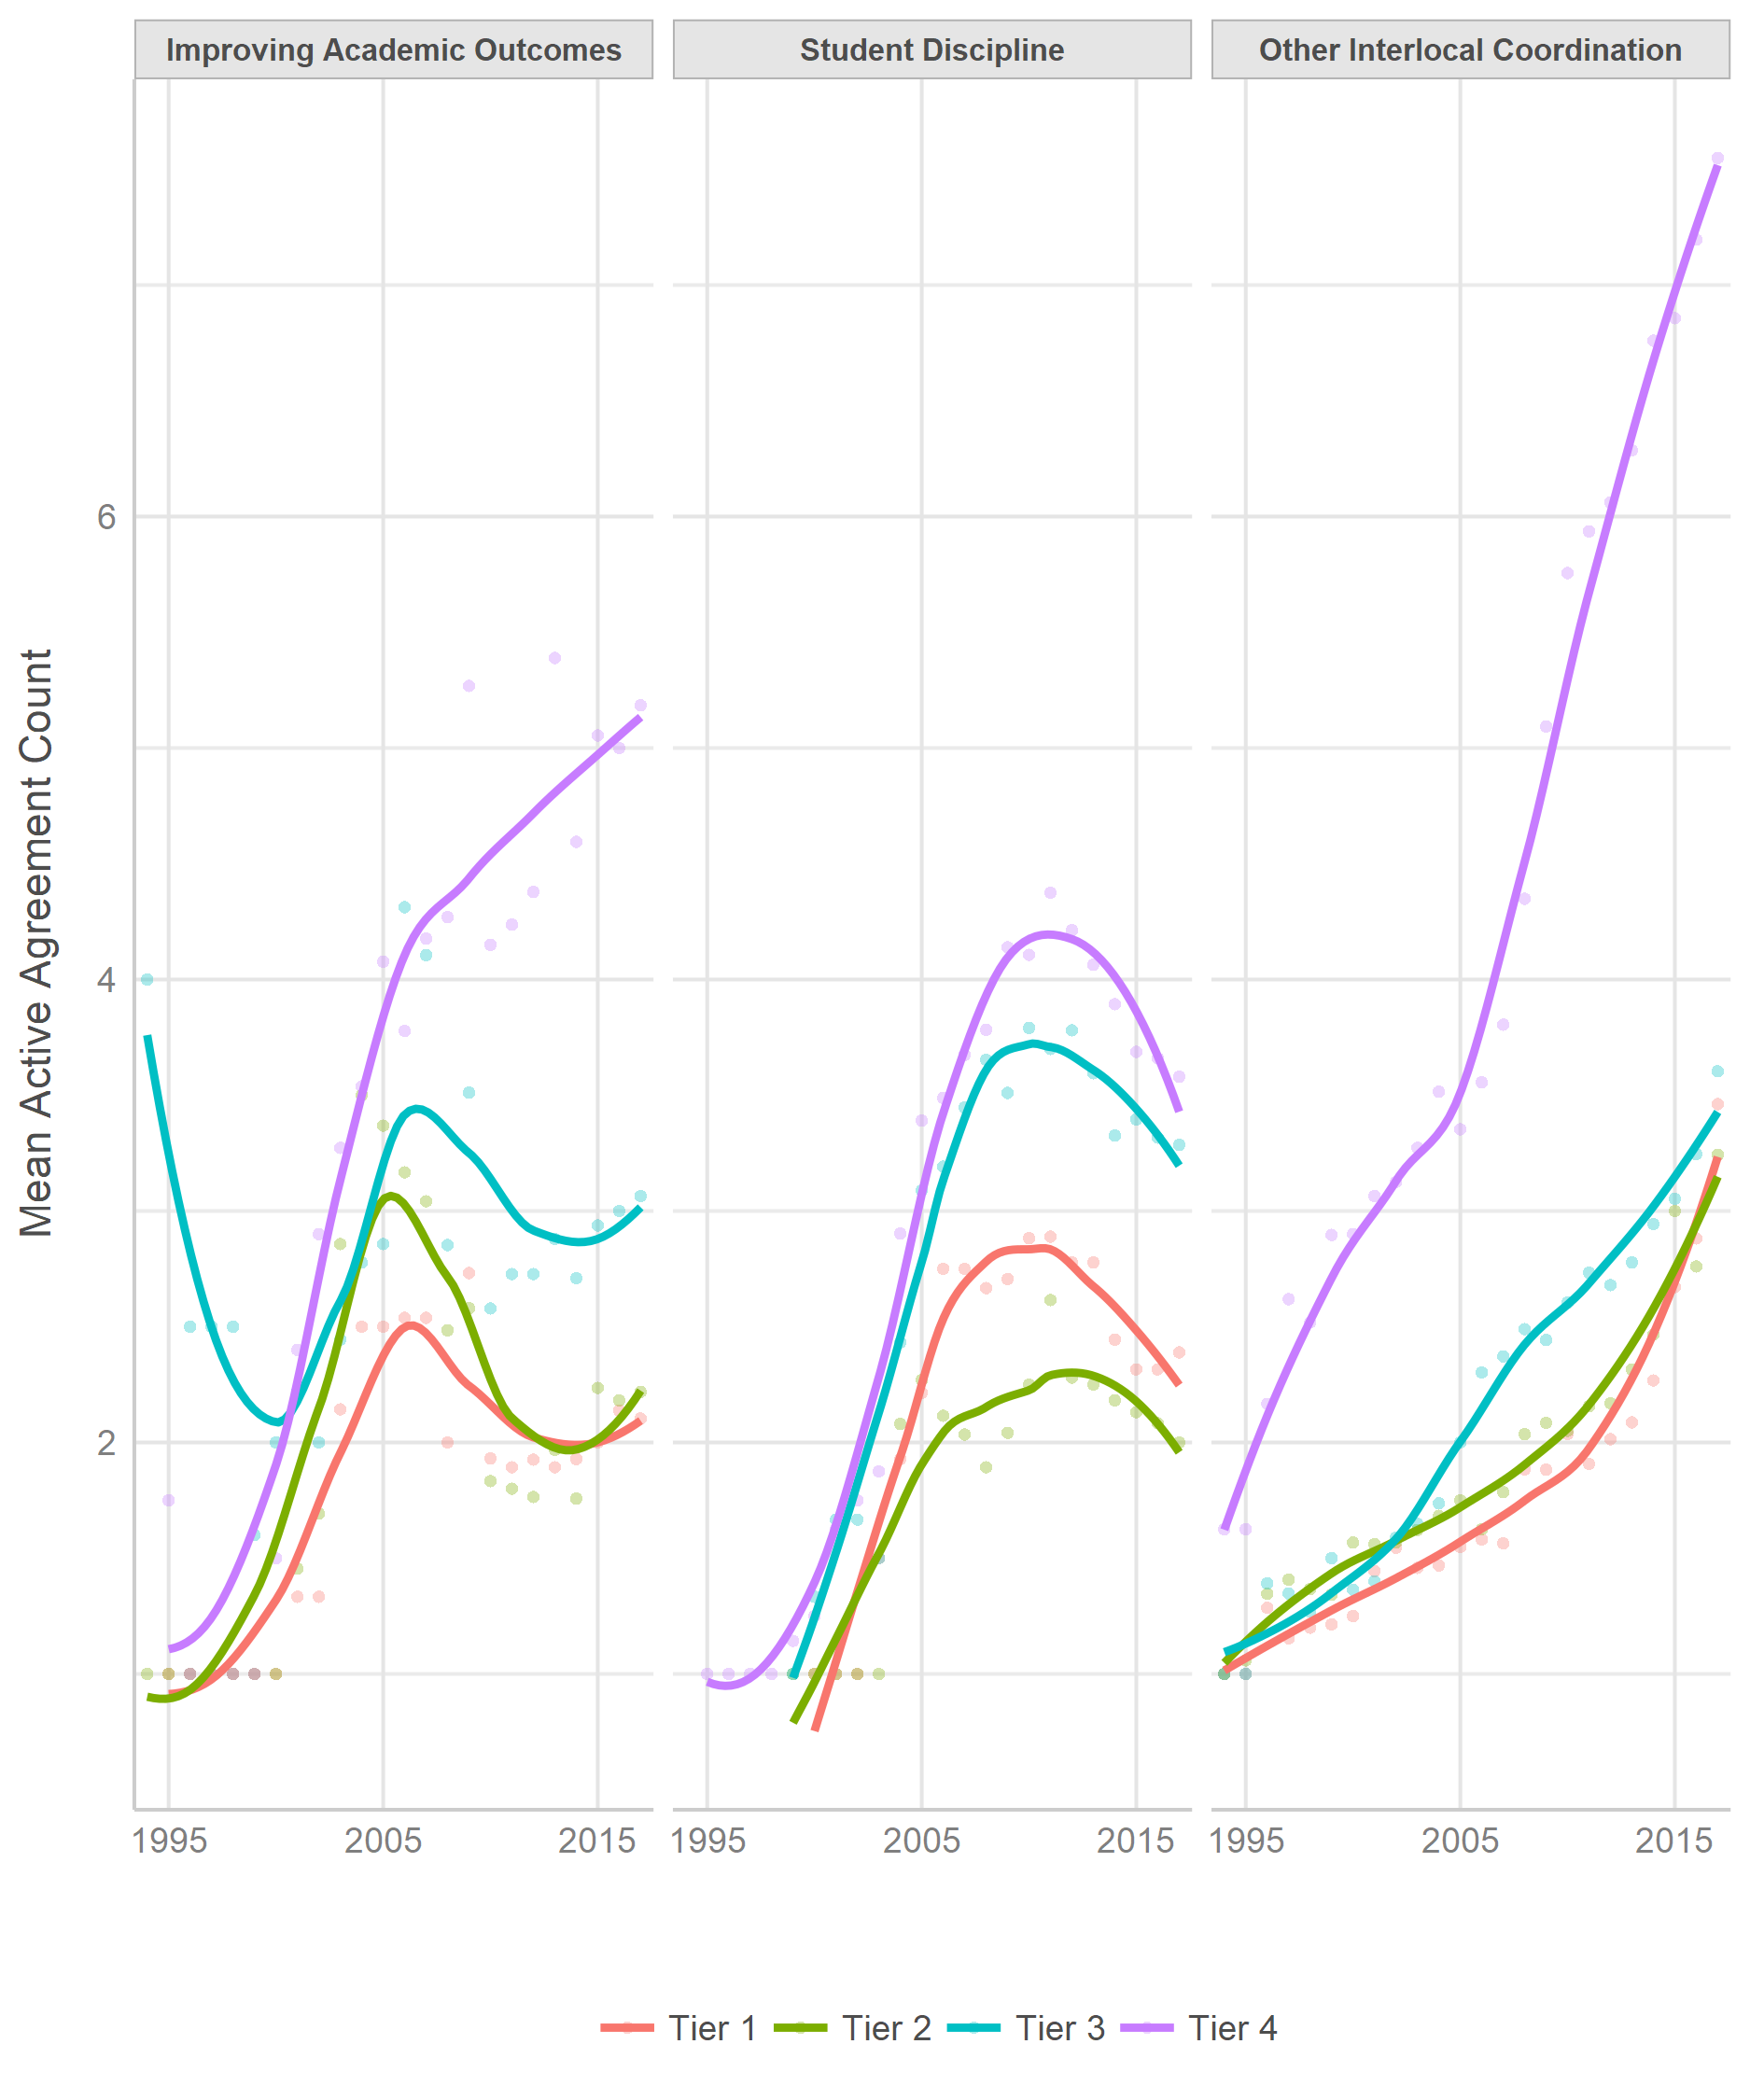
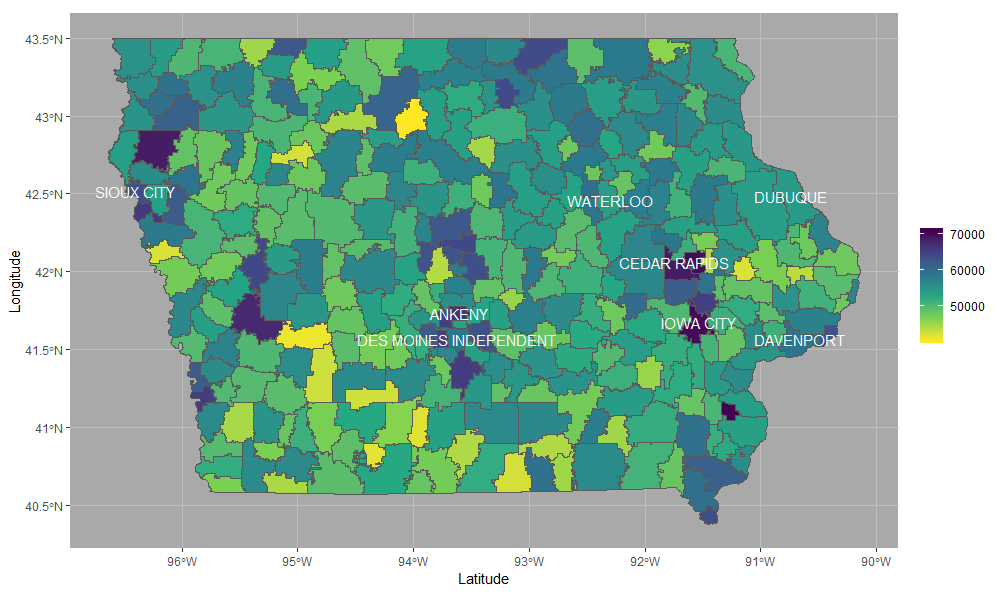
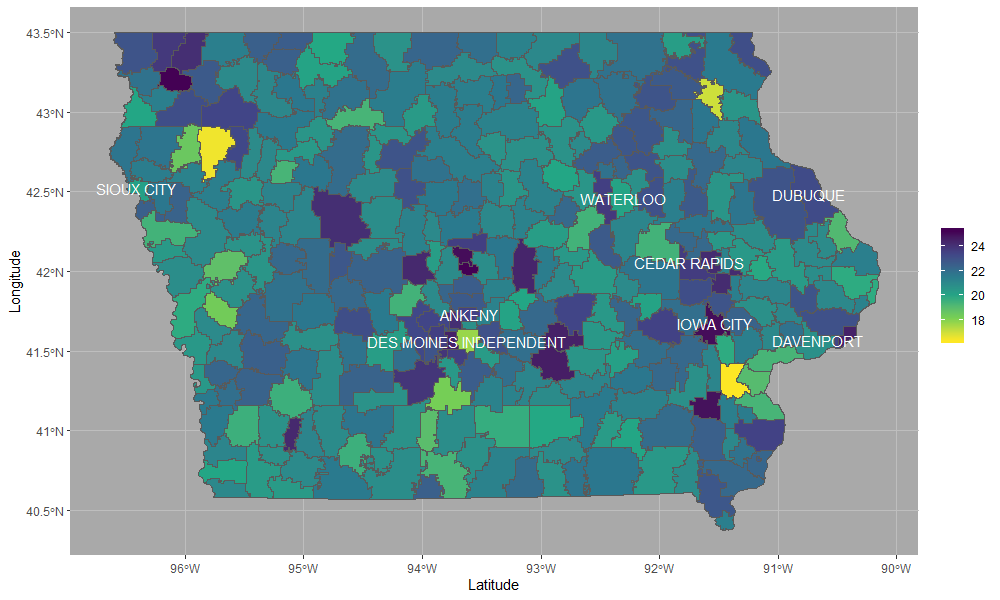
GIS Shape Files
library(sf)

district_shapes = st_read("../Data/School District Shapefiles/IowaSchoolDistrictsFY18.shp")

district_shapes$DE_DIST = as.character(district_shapes$DE_DIST)

district_shapes_with_attributes = left_join(
    district_shapes,
    imputed_normalized_attributes %>%
        filter(year == 2017) %>%
        select(
            district_code,
            enrollment,
            act_composite_mean,
            removals,
            k12_avg_daily_attendance_rate,
            non_white,
            teacher_salary
        ),
    by = c("DE_DIST" = "district_code")
)ggplot(district_shapes_with_attributes) +
geom_sf(aes(fill = teacher_salary * 1000)) +
scale_fill_viridis_c(option = "D", direction = -1) +
geom_sf_text(
data = district_shapes_with_attributes %>% filter(enrollment > 10000),
label = district_shapes_with_attributes %>% filter(enrollment > 10000) %>% pull(SchoolDist),
color = "white",
size = 4
) + xlab("Latitude") + ylab("Longitude") +
theme(
panel.background = element_rect(fill = "darkgray"),
panel.grid = element_line(color = "gray"),
legend.title = element_blank()
)Average teacher salary by public school district:
Average ACT score by public school district:
I save these by using RStudio’s export function; ggsave has trouble with scaling shape borders and text labels properly.