R Basics
Installing R and RStudio
- Download and install R: https://cran.r-project.org/
- For Windows, click on “base” to arrive at the download link.
- For macOS, you want the file that ends in “.pkg”
- For Linux, you are almost certainly an advanced user who already knows the best way to install R for your distribution.
- (Optional, Windows Only) Download and install Rtools: https://cran.r-project.org/bin/windows/Rtools/
- Having Rtools installed will allow R to compile packages from source.
- Download and install RStudio: https://www.rstudio.com/products/rstudio/download/#download
- Be sure to familiarize yourself with RStudio’s options (“Tools” Menu > “Global Options”).
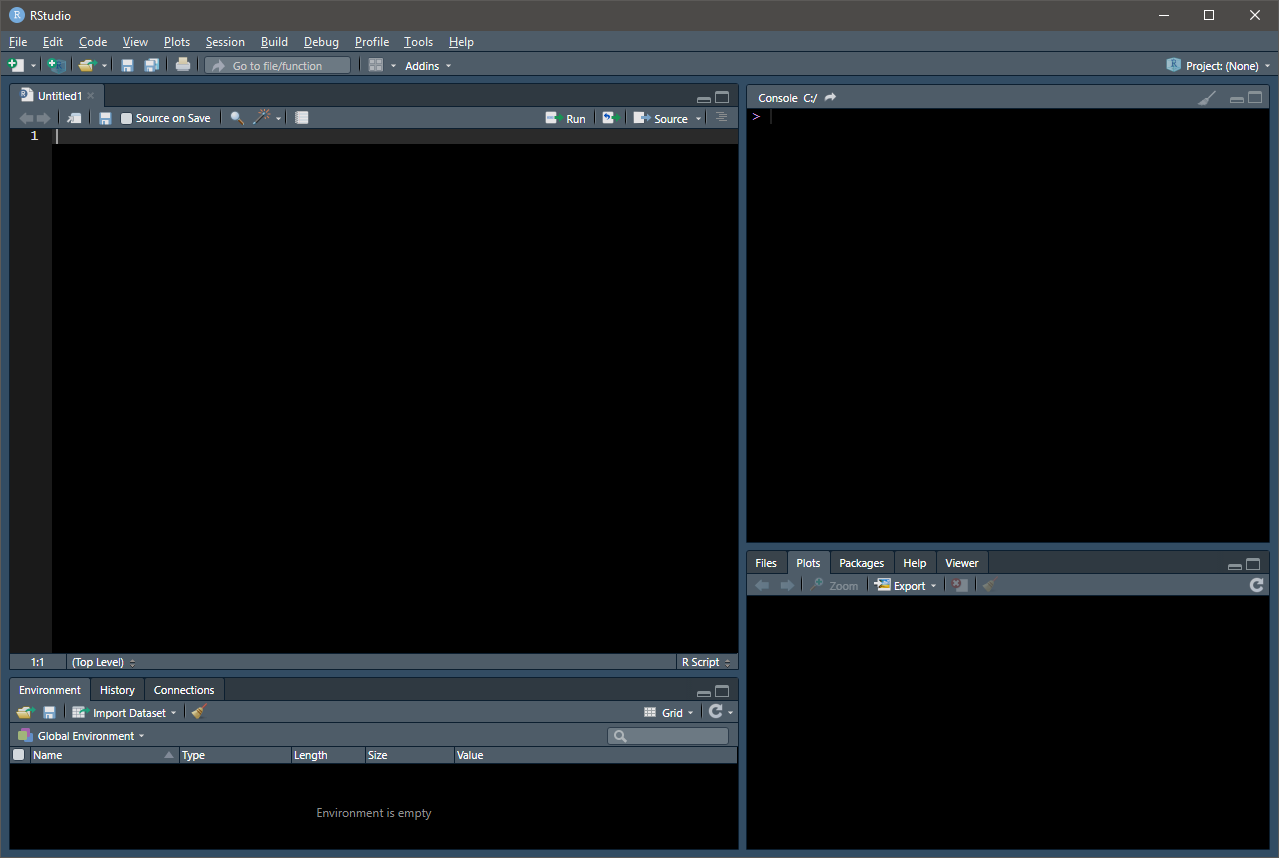
- For the love of all that is holy, select a theme that is easy on the eyes. Here’s what my RStudio looks like:
Updating R
Update R by installing new versions using the process described above or by using the handy installr package.
Set Working Directory
- RStudio Alternative: “Files” Pane > “More” > “Set As Working Directory”
- Ensure that file paths use forward slashes.
- Backward slashes only work if you add an escape character, which in R is a backslash; this leads to ugly paths.
Get Working Directory
- RStudio Alternative: “Files” Pane > “More” > “Go To Working Directory”
Installing Packages
- RStudio Alternative: “Packages” Pane > “Install”
- Explore the CRAN Task Views to discover new packages.
Loading Packages
- RStudio Alternative: “Packages” Pane > Check Off Desired Packages
- You should avoid loading libraries this way, unless you are quickly testing the functionality of a new package.
- Loading packages via script instead of in an ad hoc manner is important for replication purposes and saves a significant amount of time.
- In practice, I suggest starting every script with
library(tidyverse)since doing loadsggplot2,tibble,tidyr,readr,purrr,dplyr,stringr, andforcats.
Using Commands from Non-Loaded Packages
If you only need a single command from a given package, use a double colon to call it; in some cases, this can prevent conflicts in the command namespace.
Reading in Data
R can read virtually any tabular data file (and is rapidly improving its database capabilities).
library(readr)
df_csv   = read_csv("Comma Separated Values.csv")

library(haven)
df_stata = read_dta("Stata File.dta")
df_sas   = read_sas("SAS File.sas7bdat")
df_spss  = read_spss("SPSS File.sav")

library(readxl)
df_excel = read_excel("Excel Spreadsheet.xlsx")- RStudio Alternative: “File” Menu > “Import Dataset”
Data Wrangling
The package “dplyr,” included in the tidyverse, includes several verbs that ease data munging:
library(dplyr)
df_example %>% select()    # Subset columns.
df_example %>% filter()    # Subset rows.
df_example %>% arrange()   # Sort/order by columns.
df_example %>% mutate()    # Create new variables/columns.
df_example %>% group_by()  # Groups data by variable.
df_example %>% summarize() # Reduce multiple values to a single value.
The arduous process of data tidying falls outside the scope of a cheat sheet, but learning how to combine the above verbs with the powerful pipe operator will make your life significantly easier.
Correlation
## Rows: 30
## Columns: 7
## $ rating     <dbl> 43, 63, 71, 61, 81, 43, 58, 71, 72, 67, 64, 67, 69, 68, ...
## $ complaints <dbl> 51, 64, 70, 63, 78, 55, 67, 75, 82, 61, 53, 60, 62, 83, ...
## $ privileges <dbl> 30, 51, 68, 45, 56, 49, 42, 50, 72, 45, 53, 47, 57, 83, ...
## $ learning   <dbl> 39, 54, 69, 47, 66, 44, 56, 55, 67, 47, 58, 39, 42, 45, ...
## $ raises     <dbl> 61, 63, 76, 54, 71, 54, 66, 70, 71, 62, 58, 59, 55, 59, ...
## $ critical   <dbl> 92, 73, 86, 84, 83, 49, 68, 66, 83, 80, 67, 74, 63, 77, ...
## $ advance <dbl> 45, 47, 48, 35, 47, 34, 35, 41, 31, 41, 34, 41, 25, 35, ...##
## Pearson's product-moment correlation
##
## data: rating and complaints
## t = 7.737, df = 28, p-value = 1.988e-08
## alternative hypothesis: true correlation is not equal to 0
## 95 percent confidence interval:
## 0.6620128 0.9139139
## sample estimates:
## cor
## 0.8254176The easystats project’s correlation package, while not on CRAN, is the best at examining multiple correlations at once.
## # A tibble: 21 x 10
##    Parameter1 Parameter2     r  CI_low CI_high     t    df        p Method n_Obs
##    <chr>      <chr>      <dbl>   <dbl>   <dbl> <dbl> <int>    <dbl> <chr>  <int>
##  1 rating     complaints 0.825  0.662    0.914 7.74     28  4.17e-7 Pears~    30
##  2 rating     privileges 0.426  0.0778   0.682 2.49     28  1.89e-1 Pears~    30
##  3 rating     learning   0.624  0.340    0.803 4.22     28  4.16e-3 Pears~    30
##  4 rating     raises     0.590  0.292    0.784 3.87     28  9.57e-3 Pears~    30
##  5 rating     critical   0.156 -0.216    0.489 0.838    28  1.00e+0 Pears~    30
##  6 rating     advance    0.155 -0.217    0.488 0.831    28  1.00e+0 Pears~    30
##  7 complaints privileges 0.558  0.248    0.765 3.56     28  1.88e-2 Pears~    30
##  8 complaints learning   0.597  0.301    0.788 3.94     28  8.50e-3 Pears~    30
##  9 complaints raises     0.669  0.407    0.829 4.77     28  1.05e-3 Pears~    30
## 10 complaints critical   0.188 -0.185    0.513 1.01     28  1.00e+0 Pears~    30
## # ... with 11 more rows